- Get directions
- Leave a review
- Claim listing
- Bookmark
- Share
- Report
- prev
- next
- Tuesday, April 25, 2023 @ 7:00 am
Inventors who are resident in Switzerland contribute disproportionately to the global biotech patent portfolio, in terms of both quantity and quality. The claim that Swiss biotech inventions provide global solutions is justified by their high impact, combining technological relevance with a broad coverage of global markets. Three out of four biotech patent applications listing Swiss inventors are international inventions. This exceptionally high rate, which applies equally to private companies and to public research institutions, illustrates the strong international collaboration network of Swiss-based inventors.

Christian Moser
Swiss Federal Institute of Intellectual Property | Patent Expert

David Rees Swiss
Federal Institute of Intellectual Property | Patent Expert
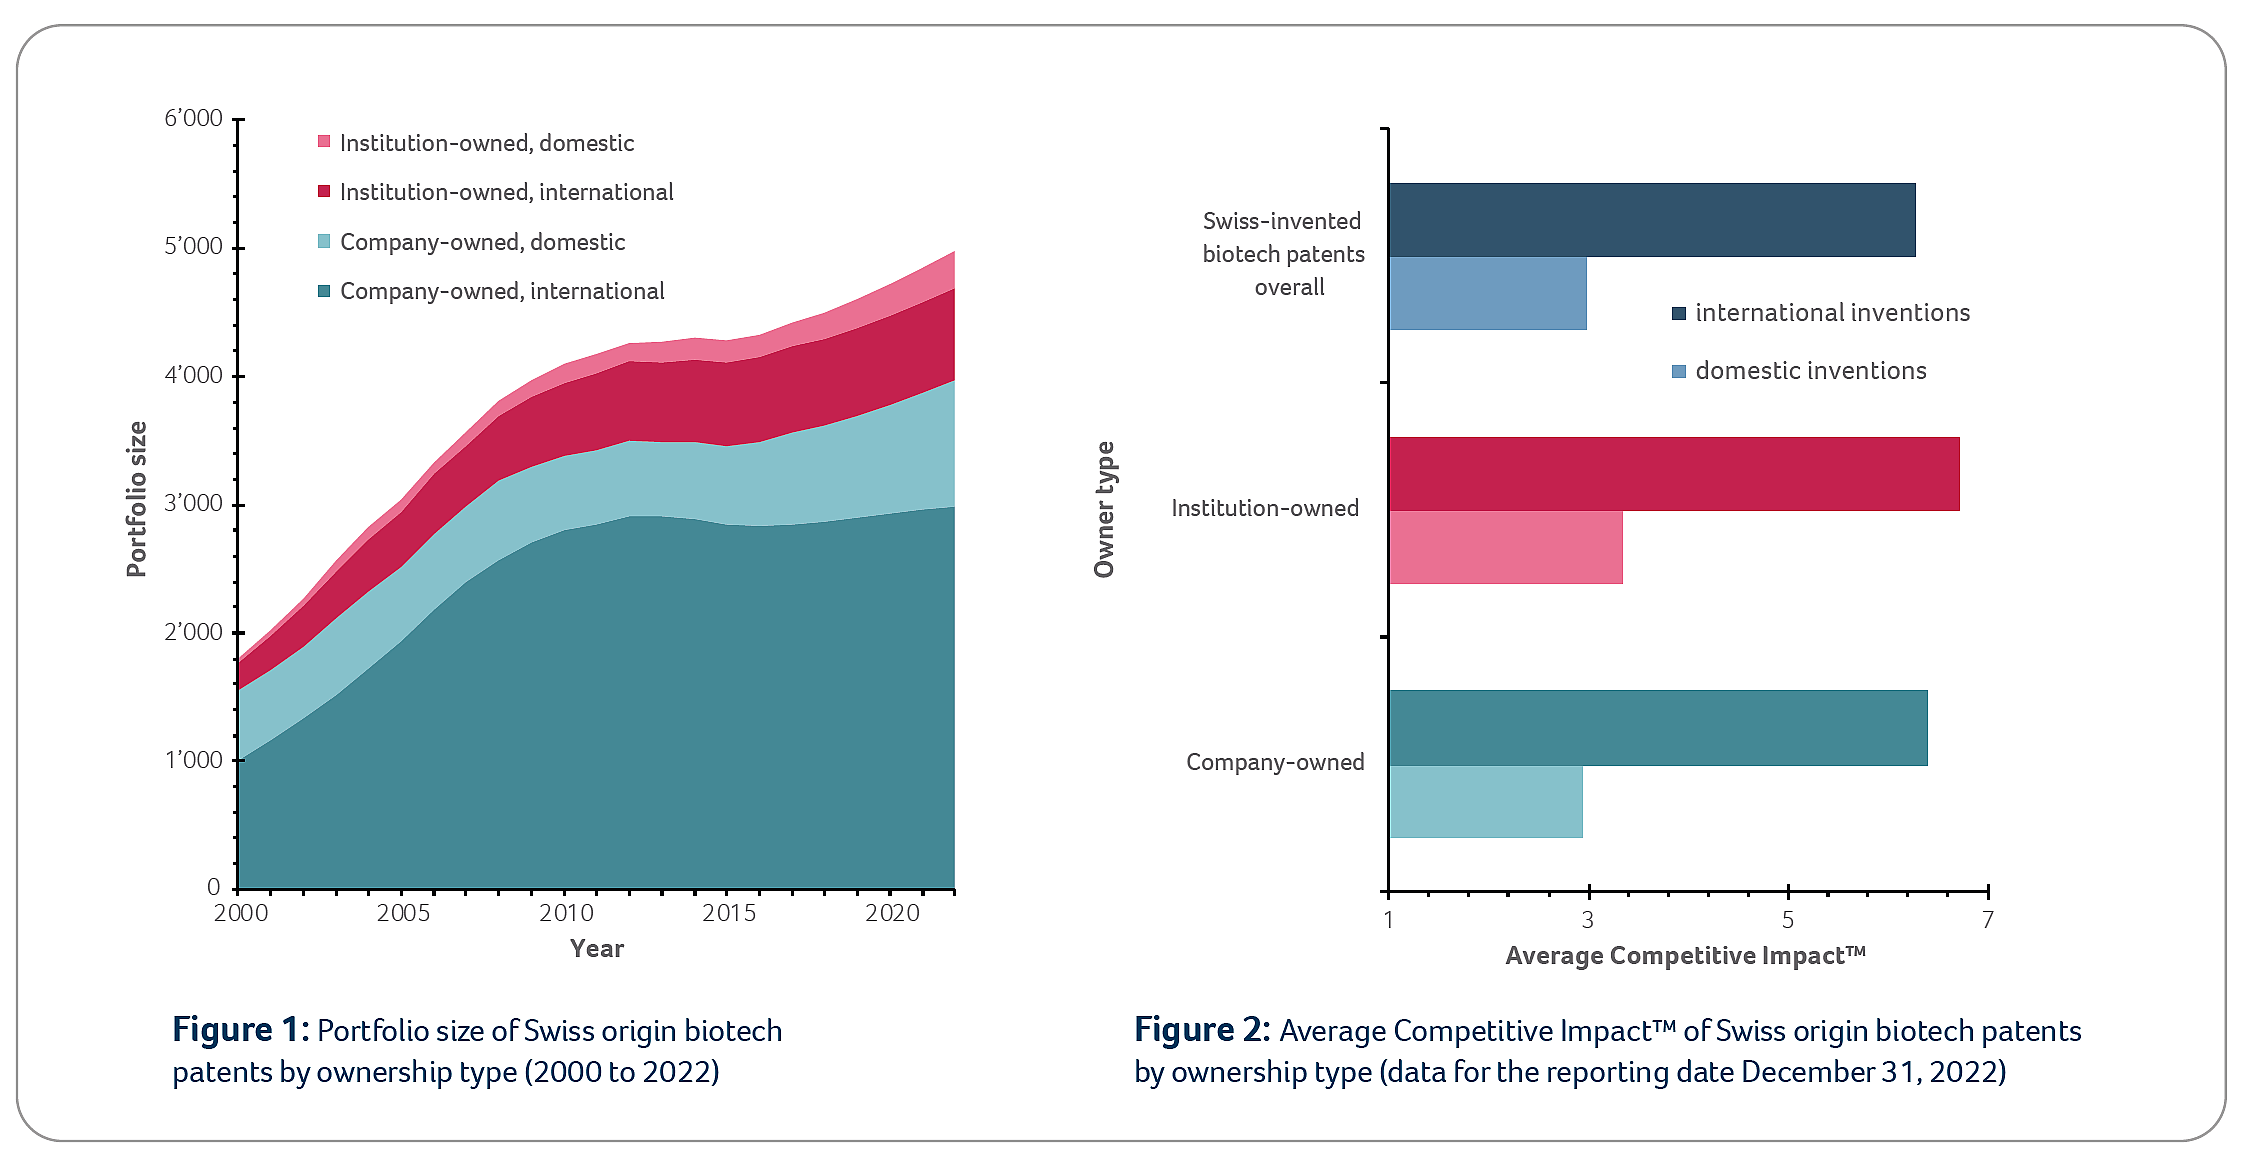
Three quarters of biotech patents of Swiss origin are in fact international inventions
Around 75% of biotech patents with Swiss-based inventors list co-inventors from other countries. Only 25% are pure domestic inventions, exclusively listing inventors who are resident in Switzerland. Such a high proportion of international inventions is exceptional in comparison to other countries.
Figure 1 shows that private companies own around 80% of the Swiss-invented biotech patents and that the high proportion of international inventions has remained essentially constant over the past two decades, irrespective of the owner type, i.e. private companies or public research institutions.
Figure 2 shows a comparison of the average Competitive Impact™ (CI) of domestic and international inventions of Swiss origin. International inventions are more than twice as strong, irrespective of the owner type.
Co-inventor countries of Swiss biotech patents
Figure 3 shows the contributions of inventors from other countries to the 4’767 currently active biotech patents with Swiss inventors, also represented in Figure 4 by the red dot labelled CH.
Around 30% of Swiss biotech patents list co-inventors from either Germany or the US, and 16% list co-inventors from France. The Competitive Impact™ varies significantly for different co-inventor countries, but it is consistently higher than the CI of 3 for Swiss domestic inventions.
Among the top 20 co-inventor countries, the highest average CIs are found for patents with co-inventors from China, Costa Rica, South Korea, and Poland. However, single patents with exceptionally high CIs and multiple countries of origin appear multiple times in this graph, thereby increasing the average CIs of all countries included. In smaller sets, this effect is particularly strong.
For example, the set for co-inventors from Poland comprises 31 patent families with an average CI of 24. This set includes a CRISPR/Cas patent family featuring nine countries of origin and an impressive CI of 500. This patent alone accounts for an average CI of 17 within the Poland set. In addition, the same patent is included in its eight other countries of origin with similar effect.

(data for the reporting date December 31, 2022)
Top biotech inventor countries: international collaboration correlates with quality
Figure 4 shows the top 20 countries of origin of biotech patents by quantity, i.e. by portfolio size. Patents involving Swiss-based inventors feature both the highest proportion of international inventions and the highest Competitive ImpactTM. Most other European countries cluster in the same upper right quadrant.
The large patent portfolios of China, USA, Japan and South Korea comprise less than 30% of international inventions and have relatively low Competitive Impact™.
Surprisingly, India appears in the top right quadrant, next to Switzerland. However, the India data should perhaps be interpreted with caution, because domestic inventions from India may not be fully recorded in the database.
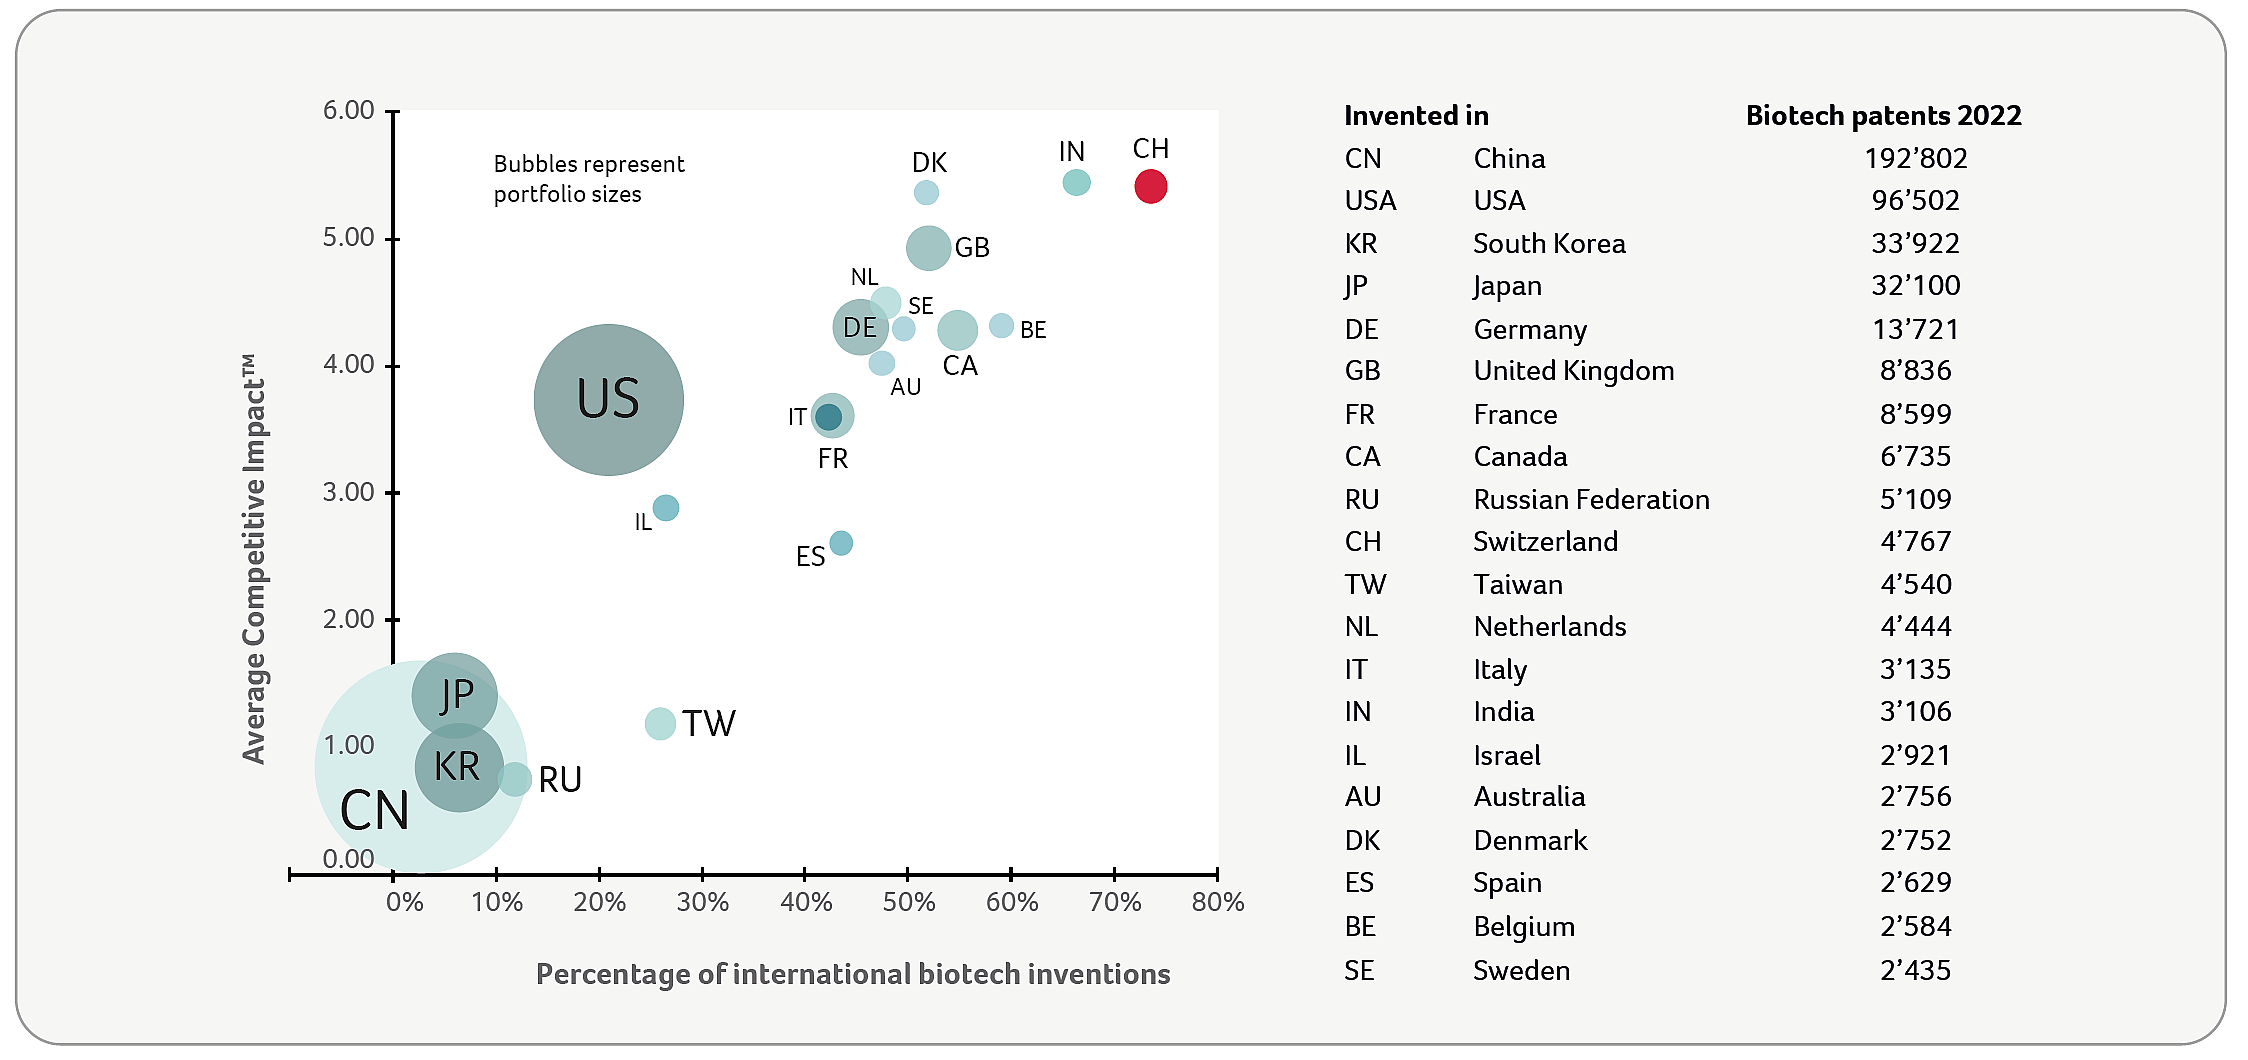
2022)
Take home messages
- Swiss inventors contribute disproportionately to the global biotech portfolio, with regard to both quantity and quality.
- A large proportion of the Swiss biotech inventions are the result of international collaboration.
- All these aspects have remained roughly constant over the past two decades, despite substantial dynamics in the global and the Swiss biotech portfolio.
- Within the Swiss-invented portfolio, the quality parameters, as well as the proportion of international inventions are strikingly similar for both owner types, private companies and public research institutions.
A strong track record may well facilitate access to collaborations with renowned partners worldwide and increase the chances for further achievements. This self-amplifying cycle could be one of the reasons for Switzerland’s longstanding leading position in the biotech sector. The smaller a country and its domestic economic base is, the higher the pressure is to seek international collaboration in order to succeed.
Data source and methodology
Inventions resulting from international collaboration are directly identifiable in patent documents, because the inventors and their country of residence are part of the bibliographic data. The data shown in this article were generated using the patent analysis platform PatentSight (LexisNexis) with reporting date December 31, 2022. The Competitive Impact™ is an indicator of the individual strength of a given patent family, derived from the citations received (Technology Relevance™) and the market size it protects (Market Coverage™).